Trending

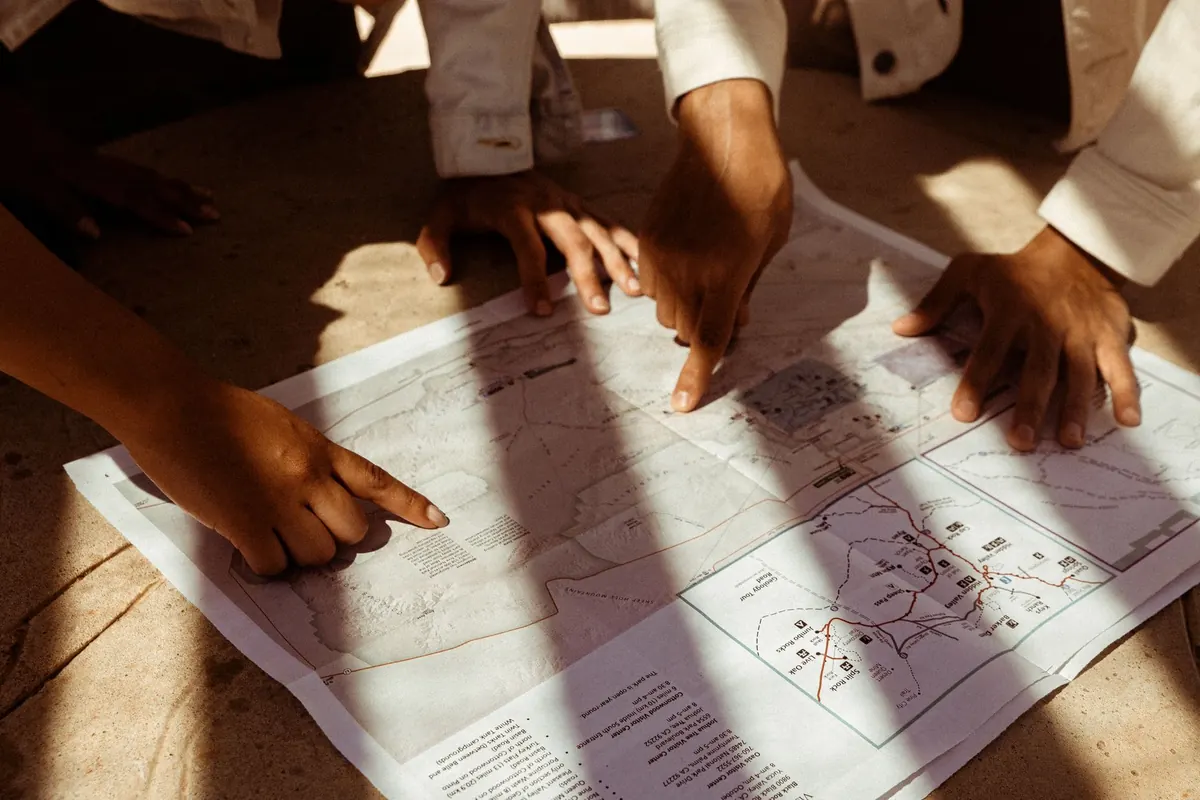
An island map looks innocent enough: blue water, green land, a few roads. Then you unfold it on a windy ferry deck and notice contour lines packed like fingerprints, a tide table in the corner, and a legend that seems to speak in code. The difference between a good day and a long one often comes down to reading those details before you set off. Scale, contours, tides, and legends are the four elements worth learning first.
Scale tells you how much ground fits into a centimetre of paper. On a 1:25,000 map, one centimetre represents 250 metres on the ground, so four centimetres make a kilometre. On a 1:50,000 map, the same four centimetres cover two kilometres. That difference matters on an island where a headland can hide a steep climb or a beach that looks close may sit beyond a tidal inlet.
Use the representative fraction for a quick sense of detail, then switch to the bar scale for measuring. Mark a distance on a strip of paper or compass edge, lay it against the bar scale, and read the result. If you work from a photocopy or screen, trust the bar scale rather than the printed ratio—graphical scales change with the map, while the ratio does not.
Island maps often come in several scales. A 1:50,000 sheet is good for seeing the whole island and planning a loop; a 1:25,000 sheet is better for paths, fences, and the exact shape of a cove. If the map has grid squares, learn what one represents—often one kilometre, but check. Then add a reality factor: a six-kilometre path on paper can feel longer with 300 metres of ascent, a boggy section, or a headwind.
Contour lines join points of equal height. The contour interval—the vertical distance between lines—is printed in the legend, often 10 or 20 metres. Close lines mean steep ground. Widely spaced lines mean gentle slopes. If five 10-metre contours bunch between you and the sea, you are looking at a 50-metre climb in a short distance; the map is telling you to budget time and energy, not just distance.
Look for index contours, usually darker and labelled with their height. Spot heights give summits and knolls. Valleys often show contours bending into a V or U shape, with the point aiming uphill; streams run down the middle. Ridges are the opposite—higher ground between valleys, often with better views and more exposure. Cliffs may appear as a tight row of contours, a hachured symbol, or a bold coastal line. On islands, a crowded cluster at the shoreline means a steep drop to the water; a wide gap suggests a gentler approach.
When planning, avoid crossing contours at right angles for long periods unless you want a direct climb. Following a valley or ridge gives a more natural line. Use the map to find shoulders and saddles where a path can traverse without unnecessary up-and-down. And check the interval before comparing two maps: a 10-metre interval and a 20-metre interval will look very different on the same land.
Island maps often show the shore at chart datum, a low-water reference. The beach, rock platform, or causeway you see on paper may be underwater at high tide—or wider than expected at low water. Tidal range changes with the moon and season; spring tides produce higher highs and lower lows, while neap tides are more modest. Local shape matters too: a shallow bay can expose a huge flat, while a narrow channel can funnel fast-moving water.
Before a coastal walk, check an official tide table for the right port and date, and note the time zone and daylight saving. Write down high and low water times and predicted heights. You need to know whether your route crosses a tidal causeway, beach, or rock shelf, and how long the safe window lasts. Tidal streams around headlands can be strong enough to affect swimming, kayaking, and rock-hopping, so treat coastal symbols as prompts for local advice.
A map can show a dotted path across sand, but it cannot tell you how fast the water arrives. Leave a margin, watch the shoreline behind you, and turn back before the window closes.
The legend is the map's dictionary. Read it before the route. Footpaths, bridleways, minor roads, and seasonal tracks may look similar at a glance but have different access rules. Symbols for cliffs, scree, marsh, mud, sand, rocks, and wrecks tell you what the ground and water are like. Colours carry meaning: green for vegetation, blue for water, brown for contours, black for human-made features. A dashed line might be a path, a boundary, or a power line—the legend settles it.
Check the north arrow and grid. True north, magnetic north, and grid north are not the same, and magnetic declination changes over time. If you use a compass with the map, set the declination or use the margin diagram. Look at the map's date and revision notes; an old edition may miss a new bypass, a closed path, or a changed ferry landing. If the sheet mentions a geodetic datum, note it—especially if you are matching coordinates from a GPS device. The small print also gives the contour interval, the scale, and often the source of tidal information. Those details are the assumptions behind every measurement you make.
Before committing to a route, run the same short sequence. It catches most beginner errors.
Fold the map so the scale, legend, and tide notes stay visible. Mark your start, intended route, and two bail-out points. Carry a compass even if you use a phone, and keep the map dry. Tell someone where you are going and when you expect to be back. Then check the weather and local advice at the harbour or visitor centre—conditions around an island can change faster than any contour line suggests. Read the numbers, trust the tide table, and give the terrain the respect it asks for. The map is not there to remove uncertainty; it shows you where the uncertainty lives.
Photo: Wendy Wei / Pexels